|
Archive
Blog
Cast
Forum
RSS
Books!
Poll Results
About
Search
Fan Art
Podcast
More Stuff
Random
Support on Patreon |
|
New comics Mon-Fri; reruns Sat-Sun
|
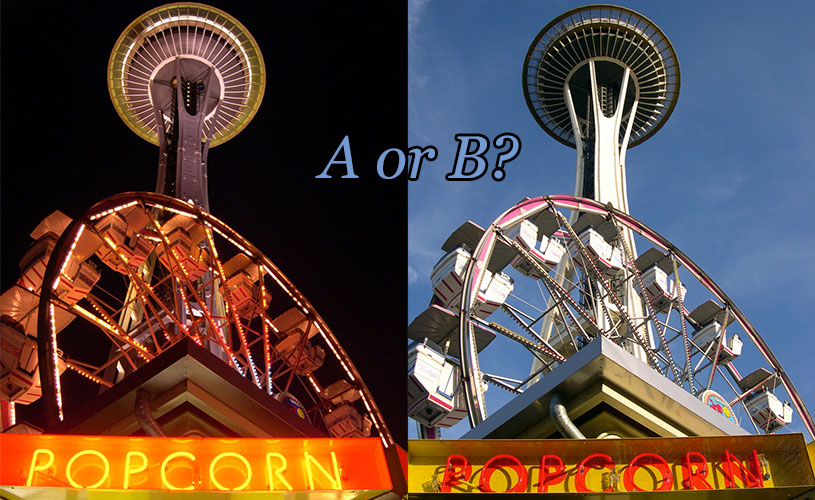
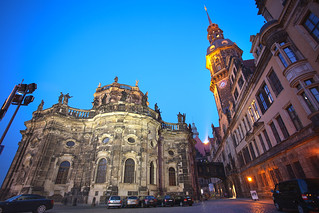
1 {two slightly different photos of the Seattle Space Needle}
1 Caption: A or B?
|
First (1) | Previous (3321) | Next (3323) || Latest Rerun (2580) |
Latest New (5175) First 5 | Previous 5 | Next 5 | Latest 5 Annotations theme: First | Previous | Next | Latest || First 5 | Previous 5 | Next 5 | Latest 5 This strip's permanent URL: http://www.irregularwebcomic.net/3322.html
Annotations off: turn on
Annotations on: turn off
|
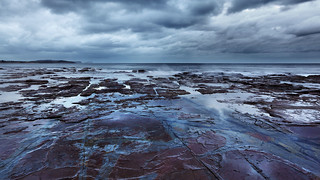
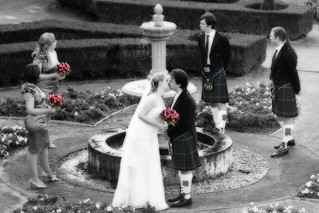
  Same photo, processed differently. Which do you prefer? |
User preference testing[1] is an age-old method of gathering quantitative data on how various factors affect human perception and response. It's a realm in which "hard" science in the form of mathematical analysis of physical properties such as colour, contrast, and noise level in images necessarily meets the "softer" science of psychological reactions to those properties. You can get a mathematically determined answer to a question like "what is the contrast level in this image?", but it's not so clear how to do it, or even if you can, for a question like "how good is this image?", or even "what is the image quality of this image?" This intersection of psychology and physics is known as psychophysics.
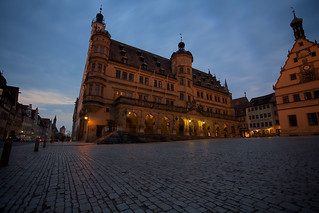
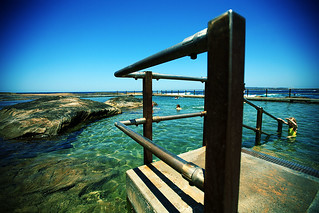
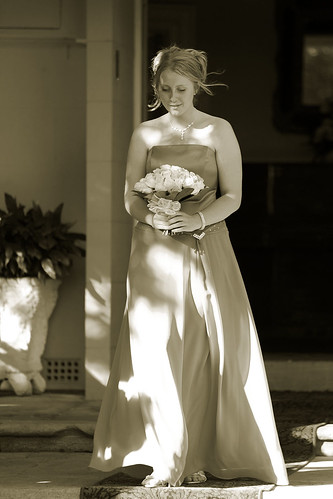
  Which do you prefer? |
The complication here is that human visual perception is highly dependent on image context and features. As another example, if you geometrically distort a photo of a forest or a beach, you might not even realise anything has been done to the photo. But if you distort a photo of a person's face by the same amount, or even less, it is very noticeable, and often disturbing. So people can very easily prefer badly reproduced images over ones that are much more faithfully reproduced, depending on what they are images of.
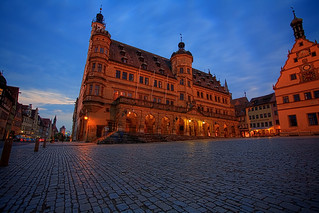
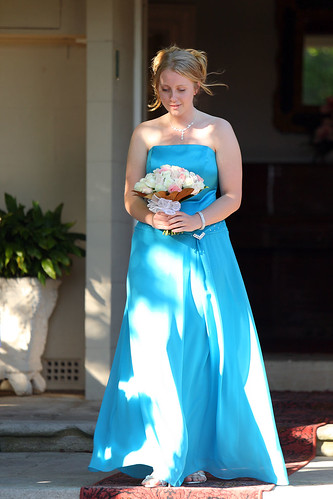
 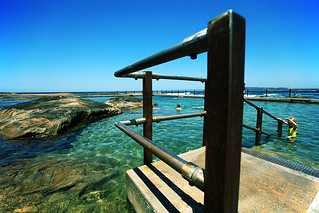 Which do you prefer? |
There are scientific methods of approaching these sorts of subjective questions. The questions involve human judgement, so the methods are experiments which also involve human judgement. The basic method of deciding which image looks "better" is known as pairwise comparison. In this method, a person is shown two versions of the same image, which have had different image processing operations performed on them (one of the operations may be "nothing"), and asked to decide which one they prefer. This can either be done by showing them both of the images at once, or just one at a time and allowing them to flip back and forth. (Other factors such as size of display or time constraints may dictate which of these methods is used.)
Asking one person which image they like better doesn't necessarily get you the "right" answer. Individuals have different preferences. One person might prefer versions of an image with bright, vivid colours in general, while someone else might prefer more muted, realistic colours, for example.[2] But if you repeat the experiment with a large number of people, you can build up a model of the statistical distribution - the proportions of people who prefer image A over image B, or vice versa, or who have no preference.
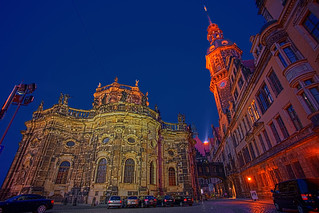
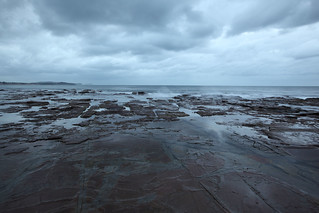  Which do you prefer? |
A practical application of all this is image and video compression technology. Images contain lots of data, and so take up lots of memory space in computer hardware - more than almost any other type of commonly stored file. If you can reduce the amount of data needed to store an image, you can squeeze more into a given amount of data storage. So there's a high incentive to compress image data, which is to recode the data so that you can reconstruct the image from fewer bits of data. You can't get something for nothing, so something's gotta give. Rather than reconstruct the image perfectly, the most efficient compression algorithms actually throw away some of the data necessary for a perfect reconstruction, and concentrate on coding the data needed to reconstruct the image so that to a person it looks "good enough".[3] How you decide what bits of the image are necessary and what bits can be discarded is done by reference to user testing models to determine which particular features in an image are least noticed by humans when they are slightly degraded. This is the principle behind the popular JPEG image file format (though I've left out much of the technical detail - maybe another day). Lossy compression is also used for the popular MP3 audio coding file format.
  Which do you prefer? |
The result of this is that these sorts of user tests for image preference testing have tended to be done with samples of just a few tens up to maybe a hundred observers. The statistics you get out of this can be useful, but they are prone to sampling errors due to the small sample size. Furthermore, many image preference scenarios are culture dependent. People of different ages, sexes, or ethnic or cultural backgrounds can have highly different responses to images. It is known, for example, that American observers have different preferences for the photographic reproduction of human skin tones than Japanese observers. So you need to be careful how you choose your observers, split them apart based on demographic data about them, and interpret your results keeping this in mind. This further serves to make the statistics less reliable by reducing the sample sizes of consistent populations.
The new trend in observer testing is to go in very much the opposite direction. Sample as many people as you can, but without worrying too much about identically calibrated monitors and distraction-free environments. The way to do this is to take advantage of crowdsourcing, using the Internet to reach hundreds or thousands of people. You can either do it by setting up a website with a voluntary survey, or you can use a system to recruit thousands of paid observers such as Amazon's Mechanical Turk. The idea is that you can get meaningful statistics about images - even if you have no control whatsoever over the viewing conditions of the observers - by sampling a large enough number of people to average out any variation that causes.
  Which do you prefer? |
Three years later, at the same conference, what did I see? I saw multiple research groups presenting multiple different image preference studies, all of them using Mechanical Turk to recruit thousands of observers from across the Internet (and hence around the world). They had developed techniques to analyse the statistics they gathered in a meaningful way. Part of this is to build control questions into their experimental samples. Unknown to the users, these control questions determine things like how well they can see subtle colour differences on their (uncontrolled) monitors, how repeatable their responses are over multiple trials of the same data, some basic demographic information, and how much they are paying attention to the task rather than just clicking randomly to earn a few bucks.
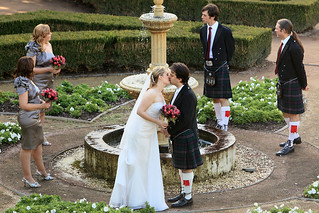
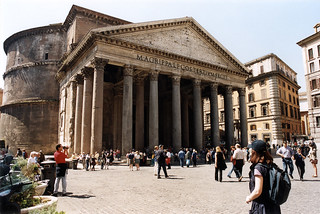  Which do you prefer? (Okay, this one is cheating slightly...) |
And the reaction to this methodology in 2014? Nobody batted an eyelid or raised any objection. In just three years the state of the art in this field of science has shifted dramatically, because somebody went out on a limb and tried something new, and got it to work. This last part is important. You can't propose wacky new ideas in science and expect to get them listened to if you can't demonstrate that they work. But if you can, then others will follow. Sometimes it takes much longer than three years, but sometimes a revolution in scientific thinking can happen very fast indeed.
And it's happening all the time, across all fields of science. Cool, huh?
[2] This is a well known example of how many people prefer images with some property a little different to reality. Most (but not all) people actually like photos better when the colours are slightly more saturated (vivid or vibrant) than they are in real life. This can be a conundrum for camera manufacturers. Do they make cameras and software which reproduces colours faithfully, or boost the saturation a bit to make it so that more people like the resulting photos?
Typically, they go for the slight boost in saturation that most people prefer. High end cameras often offer user settings which let you pick between "faithful" colour reproduction and some other settings with labels such as "vibrant" or even "normal". (There may also be a "black and white" or "monochrome" setting.) Usually the default is "normal", which is actually slightly boosted in saturation. You need to switch to the slightly duller "faithful" if you want accurate colour reproduction.
This is related to a psychophysical phenomenon called memory colours. These are the colours you associate with objects in your memory. Imagine you are given a set of paint chips of different shades of blue and asked to pick the one that matches a blue sky, but you need to do this in a closed room where you can't actually see the sky. Or given a set of greens and asked to pick the one that is the colour of grass. Or a set of oranges and asked to pick the one that matches the colour of a real orange. When people are asked to do this, they almost invariably pick a colour that is more saturated and vivid than the real object. In your memory, skies are bluer than they are in reality, grasses are greener, and oranges are oranger. Researchers studying this phenomenon propose that this is the reason most people prefer images that are slightly more saturated than reality - they better match our memory of reality - though we don't yet know why our brains remember colours as being more vivid than they really are.
[3] These are so-called lossy compression algorithms, because they lose some of the original image quality. There is also lossless compression, which takes advantage of typical statistical properties of the type of file being compressed to make most typical files smaller, but at the expense of requiring more data to encode atypical files. Lossless compression gives superior reproduction quality, but lossy compression produces significantly smaller file sizes, so both methods have their uses.
|
LEGO® is a registered trademark of the LEGO Group of companies,
which does not sponsor, authorise, or endorse this site. This material is presented in accordance with the LEGO® Fair Play Guidelines. |